01 / QUERY↗
RFI-0014Uncharted HT
and telecom services
CONSTRUCTION PROJECT CONTROLS
Planvium tests your construction schedule against build order, the contractor’s method and similar past work. Then it connects approved progress, drawings and delay evidence to one locked plan.
For infrastructure owners, PMCs and EPC teams.
Working test system · Early beta · Pilot partners welcome
One engine. A connected project.
CHECK FIRST. CONNECT EVERYTHING AFTER.
The drawings, the schedule and site progress already exist. Planvium connects them before their combined effect reaches the monthly review.
↗ Choose a capability.
Or follow the story below.
01 / ASSURANCE
Works · Test system
Check the task links, the construction order, the contractor’s method and durations from similar plans. A planner reviews the findings before the plan is accepted and locked.
A check without enough evidence is “not assessable”. Findings are questions for professional review, never automatic approval.
See the product evidence ↗The schedule says “start”. The drawing says “wait”. The missing link makes the date unreliable.
The foundation starts Monday. The drawing is still waiting for approval. Without the link, the schedule hides the problem.
14 checks follow the DCMA approach. Findings support a planner’s judgement; they are not a certification.
02 / CONSTRUCTION LOGIC
Metro viaducts tested · Integration next
Follow each physical dependency, from foundation to girder. Then test an impossible order.
Scroll to assemble the span, or choose a step below.
Everything above starts with a supported foundation.
Illustrative sequence. Validated scope: metro and viaduct construction logic.
03 / EXECUTION CONTROL
Works · Test system
A field update passes through a human decision before it changes approved project progress.
A new submission arrives. The last approved position remains at 91% while the evidence is reviewed.
Review the update, then try “Approve the update”. Scrolling through this example never approves work for you.
An approved update advances the execution overlay. The original commitment remains available for comparison.
The committed baseline stays fixed. Approved progress drives the execution overlay.
See the product evidence ↗Waiting for review
Last approved position
Illustrative review · A submission changes project truth only after approval.
04 / DELAY INTELLIGENCE
Works · Test system
See where the completion date moved, window by window. Keep the recorded movement and its explanation connected.
Window W1 records the initial shift in completion. Start with the revision comparison and its linked records.
W2 adds 18 working days. The cumulative movement is now 23 days against the committed programme.
W3 recovers five working days, leaving 18 overall. Movement is measurable; responsibility still needs review.
MetroLink M-01 demonstration. Movement is measured; causation and responsibility require review.
See the product evidence ↗Working days · Recorded demonstration windows · Movement measured against the committed programme.
05 / PLANVIUM AI
Early beta · Read only
Planvium calculates. AI explains. People decide. The early assistant is strongest at explaining findings already calculated by Planvium.
Why was Reach 6 piling held? The trail starts with RFI-0014 and the uncharted services it records.
The site instruction suspends piling at the affected locations. The linked activity identifies Pier 49 in Reach 6.
Planvium AI connects the records into an explanation you can inspect. People retain the decision on causation and entitlement.
Early beta · Read only. AI never changes a plan, approves progress or decides delay claims. The linked-record example illustrates the direction; wider document retrieval is next.
See the product evidence ↗Follow the query, the instruction and the affected activity. Scroll through the evidence or open the explanation above.
Uncharted HT
and telecom services
At the affected
locations
Reach 6
Piling work
Illustrated answer from seeded records · Wider document retrieval is next · People review causation and entitlement.
06 / PRODUCTIVITY PREDICTION
Roadmap · Interactive illustration
Explore how production rate changes the indicative duration of the remaining work.
In this hypothetical example, 40 of 100 deck segments are complete. Sixty still need to be installed.
Forty segments over ten working days gives a recent rate of four per day. Change the assumed rate to explore the effect.
At four per day, sixty segments take fifteen working days. This explains one work package, not the project finish date.
Today: the status finish is recalculated from approved progress. Next: productivity-based prediction, once proven on real project history. The rate example is an illustration, not a project forecast.
Hypothetical productivity illustration
40 segments ÷ 10 working days = 4/day recent rate
60segments÷4/ day=
Assumes the same work and conditions, with no new interruptions. One work package; not a project completion date.
Productivity P50/P80 forecasts and recovery comparison are on the roadmap. The aim: connect approved production rates to the remaining programme and compare recovery options.
P50/P80 describe completion dates with different confidence levels. This example does not calculate either.

THE WORK CHANGES. THE NEED FOR CONTROL STAYS.
One connected view.
Across the built world.
DIFFERENT PROJECTS. CONNECTED DECISIONS.
Change the infrastructure. Explore what needs to happen before the next milestone.
Connect a utility clearance, the piling front it holds and the opening milestone it may affect.
Illustrative applications · Not customer deployment claims
FROM A RECORD TO A DECISION
“Eight days late” is a record. How much of that can the project absorb? Connect the drawing to its work, and the answer becomes useful.
Late means after the work needs the drawing. The buffer (float) belongs to the whole chain and can be spent only once.
Completion could move by up to 5 days if this chain drives the project finish. Check the current critical path before acting.
Interactive illustration, not a live forecast. Drawing and submittal risk works in the test system; equivalent RFI risk is in development.
WHAT MAKES PLANVIUM DIFFERENT
Schedule tools build the plan. Document systems hold the records. Planvium tests the plan against the work, then connects the records to the activities they affect.
Build order, the contractor’s method, similar past plans and 14 schedule-quality checks. Every finding has evidence for a planner to review.
Lock the accepted plan. Link drawings, approved progress, quantities and delay records to the same work. The baseline remains available for comparison.
See what is held, what can absorb the delay and who needs to act. Planvium calculates. AI explains. People decide.
WHAT CONNECTS TO THE PLAN
Choose a connection to see what it means.
Link a required drawing or submittal to its activity. Compare the expected approval date with the date the work needs it and the available buffer.
“The drawings existed. The schedule existed. The progress existed. But the warning signs came together too late.”
Bring one contract section. Your planners judge the findings, false alarms and review time saved. Build confidence before expanding.
Evidence and product status from Planvium’s October 2026 investor deck. Order rules and benchmarks are calibrated for metro viaducts. Planvium reads P6 plan files today; connections to other systems do not imply live integrations. Plans enter the evidence library only with the owner’s written consent.
THE PRODUCT BEHIND THE STORY
Explore the actual Planvium screens behind assurance, reviewed execution, AI explanation and measured delay.
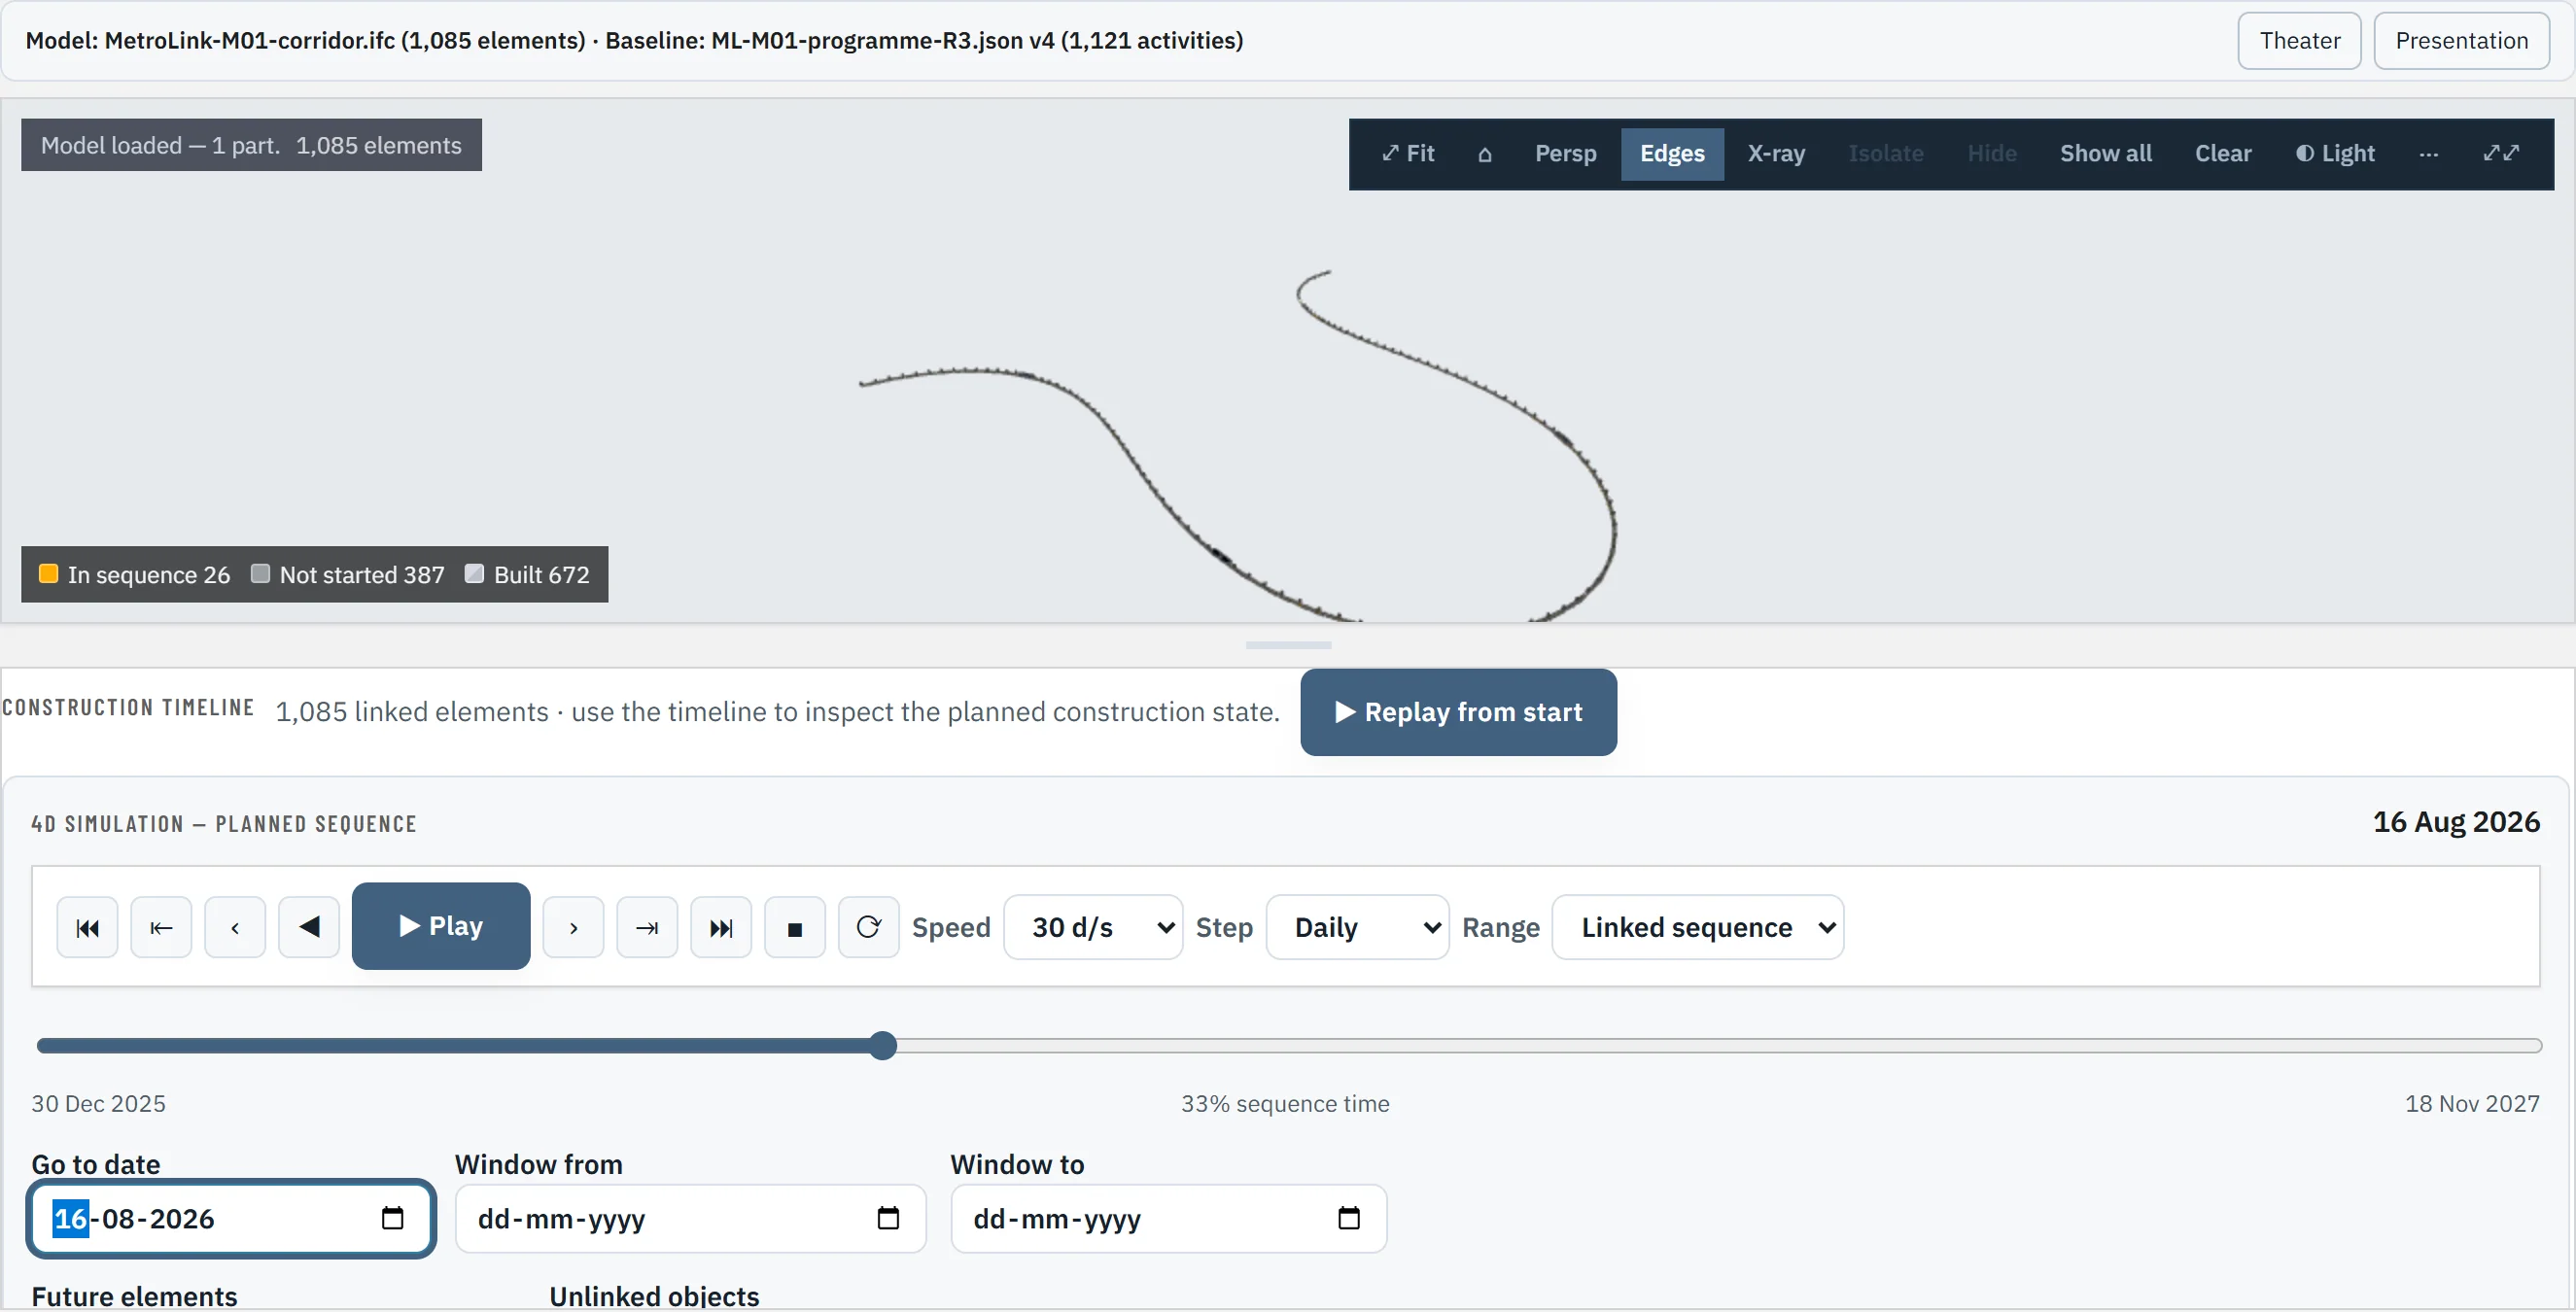
Planvium connects schedule checks with approved execution, project records and measured delay. Your planning tools remain part of the process.
YOUR PROGRAMME IS THE NEXT STEP
Start with a plan health check on one contract section. Then scope a 75-day pilot with your planners, your questions and measurable results.
Discuss your project ↗For infrastructure owners, PMCs and EPC teams.